Charting AI Interactive reads liquidity, divergences and trend across timeframes from 5 minutes to 1 week, then puts a complete setup on your chart: entry, stop and targets. Ask it questions out loud, let the daily tour walk you through the market, and buy the setups you choose from your own Solana wallet.
Sign in with a Solana wallet. No email, no card. 10 free minutes of AI every day.
The maths runs in plain, tested code. Claude explains the result and acts on it, so you get an answer you can check against the chart.
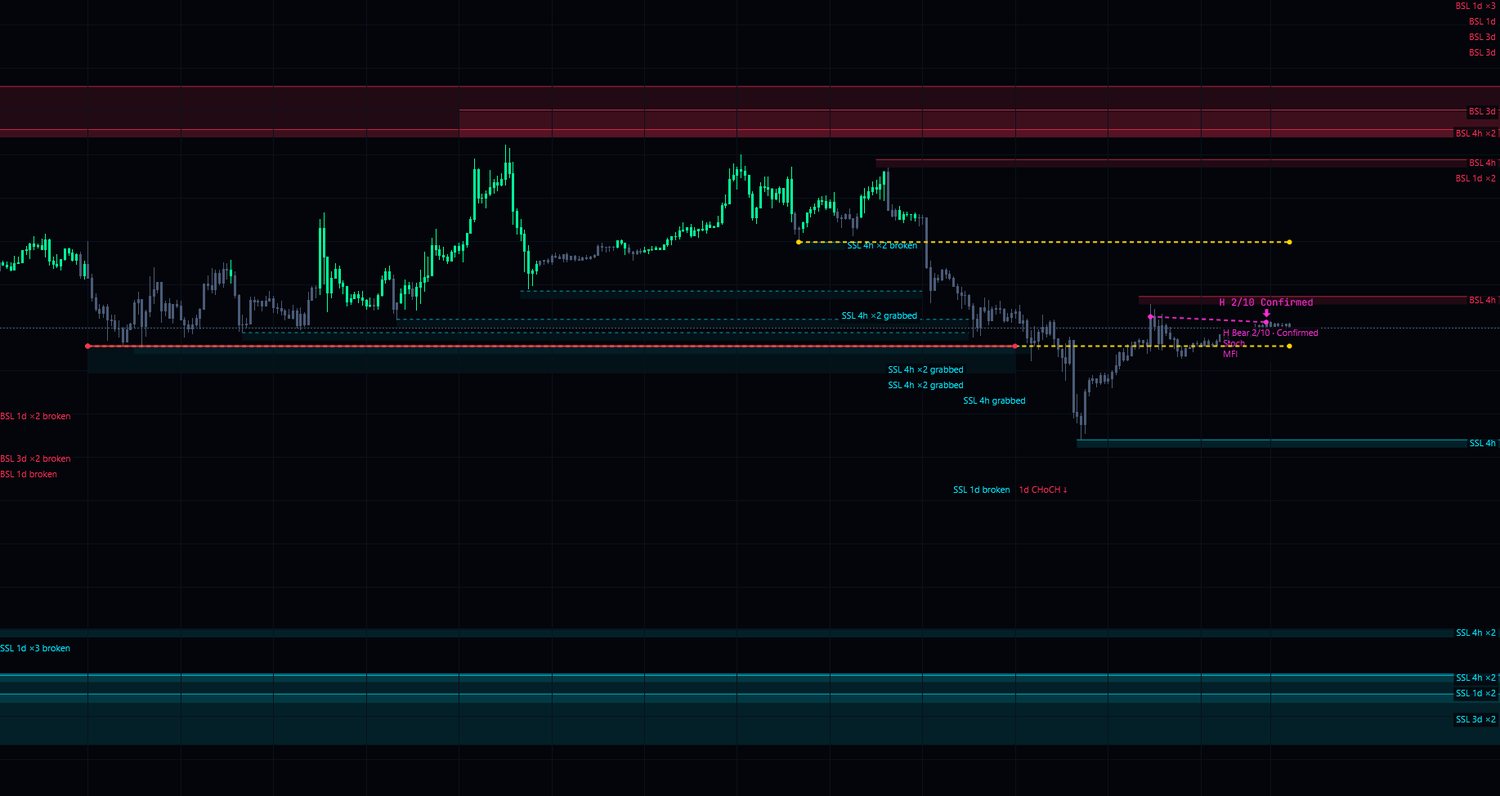
Buy-side and sell-side pools on every timeframe, equal highs and lows ranked stronger, with grab zones and a swept or rejected status.
Regular and hidden, bullish and bearish, checked against MACD, MACD histogram, RSI, Stochastic, CCI, Momentum, OBV, VW MACD, CMF and MFI. Each line is tagged like R 6/10 so you see how many agree, with forming signals marked apart from confirmed ones.
Clustered support and resistance, double tops and bottoms, head and shoulders, break of structure and change of character, drawn right on the chart.
One coloured row per timeframe with candles tinted by the weighted consensus. Live candles on 5m to 1w, with the bigger timeframes' liquidity and levels drawn on every lower chart.
LONG, SHORT or WAIT with entry, stop beyond the nearest liquidity, up to three targets and the reward-to-risk. Drawn like a position tool, thick and easy to read.
Strong-setup alerts when several timeframes agree, plus bias flips as an exit warning. Divergences alert only once the candle has closed and price action backs them up, and two or more timeframes make one alert, not a stream. Toast, chime and spoken.
Type or speak. Claude sees your analysis, draws zones and lines, switches timeframe or coin, and explains why in plain language.
The tour starts by itself a few seconds after you open the app and walks every timeframe, with no AI credits used. Watch with me adds live AI commentary and Bull, Bear and Both-cases scenario playback.
Watches eight major coins around the clock and calls out when several timeframes and signal types line up. Funding rates are shown beside each coin.
Buy SOL, BTC, ETH and more with USDC from your own Phantom wallet. A stop-loss and take-profit pair is attached to the buy. Spot only, no leverage, and you sign every step.
Load your own trade history and see your win rate, fees and results by coin, direction, holding time and time of day. It stays in your browser.
A calculator for sizing a BTC futures idea: enter entry, stop and account, and it shows position size, leverage, fee and funding reserves and a conservative liquidation estimate. It never places an order.
Connect Phantom or another Solana wallet and sign a message. No email or password to manage.
Pick a coin and timeframe. The analysis layers update live and Claude can walk you through what it sees, or draw it for you.
Adjust the spend, stop and target, then buy with USDC from your wallet. Lines on the chart follow every edit.
No subscription and no card on file. Buy credits once with USDC on Solana and use them at your own pace. They never expire.
10 minutes of AI a day.
300 credits
900 credits
1,800 credits
One credit is about one reply from the advanced Claude model. The charts, signals, scanner and daily tour cost nothing. Lasting times are estimates: full-time is roughly 45 replies a day, medium 30 and light 15, and heavier use finishes sooner. When credits run low, replies move to the standard model, and at zero you are back on the free plan. Pay in USDC from your Solana wallet. Network fees and slippage on your own trades are separate and yours to pay.
No. It suggests and draws. Live orders and Solana swaps are sent only when you press the button, and Solana transactions also need your signature in your wallet.
Charts use public Binance market data for major USDT pairs. You can buy SOL, BTC (WBTC), ETH, JUP, BONK, WIF, JTO, PYTH and RAY on Solana through Jupiter, with USDC from a Phantom wallet. Trading is spot only.
We never hold your funds or keys. Your coins stay in your own wallet and you sign every swap and order. Prices of crypto can fall quickly, so only trade what you can afford to lose.
We make no promise of that. Setups come from transparent rules on liquidity, divergences and multi-timeframe confluence, and they are probabilistic. Start with small amounts and check how they behave before you risk more.
It keeps sign-in simple and private, and it is also how payment works: credits are paid in USDC straight from your wallet.
Every AI reply uses credits in proportion to what it costs to produce, so short answers cost less and long ones a bit more. One reply from the advanced model is about one credit. Credits have no expiry date and there is no daily limit while you have them.
You see a reminder to top up. Below a small reserve, replies switch to the standard model, and at zero you are back on the free plan with 10 minutes of AI a day. You can always sell, cancel orders and withdraw, with or without credits.
The app compares price pivots with ten indicators and counts how many show the same divergence on the same pair of price points. The count (for example 6/10) is how many agree, not a chance of winning. Lines are drawn from closed candles only. Alerts need more: on 1h and above at least two indicators agree, below 1h at least four plus a price-action signal, and a stack alert needs two or more timeframes at once. It is an adaptation of an open-source script and the app does not claim an exact match with TradingView. The chart uses Binance spot data, so futures prices on other exchanges can differ.
Yes. Type to Claude, or use the mic in Chrome or Edge and hear spoken replies. Claude can draw zones and lines, switch timeframe or coin, and explain its reasoning.